The U.S. aerospace industry has more than seven times as many suppliers than the 2nd ranked country in the latest PwC’s 2015 Aerospace Manufacturing Attractiveness Rankings.

- Switzerland is ranked 2nd in the world in terms of infrastructure, stability, and talent including 1st in STEM education globally.
- Singapore ranked 3rd in infrastructure, stability, and workforce globally.
These and other key insights are from the recently published Pricewaterhouse Cooper’s 2015 Aerospace Manufacturing Attractiveness Rankings. The study can be downloaded here (free, PDF, no opt in). The attractiveness rankings are among the most popular research studies PwC does of the global aerospace manufacturing industry. The findings also have strategic significance to any aerospace manufacturer evaluating their manufacturing execution systems (MES) investments and strategies and their scalability into new, high growth markets.
PwC has made significant enhancements to last year’s global ranking methodology including the addition of infrastructure, regulatory and corruption metrics. PwC explains these additions help provide a more robust assessment of the manufacturing environment in which aerospace companies compete in daily.
A welcome refinement for fans of this report is the use of proportionality in industry rankings to better reflect the size and scale of the aerospace industry among countries. PwC notes the U.S. has seven times the number of suppliers as the next largest country. Please see the report for detailed rankings by country and also by U.S. states.
Key take-aways include the following:
- The United States, Singapore, Hong Kong SAR China, Switzerland, United Kingdom, Canada, Qatar, United Arab Emirates, Luxembourg and Ireland are the top ten countries by ranking in terms of aerospace manufacturing effectiveness. The graphic below illustrates the global distribution of companies by manufacturing effectiveness taking into account cost rank, industry rank, and infrastructure/stability/talent rank.
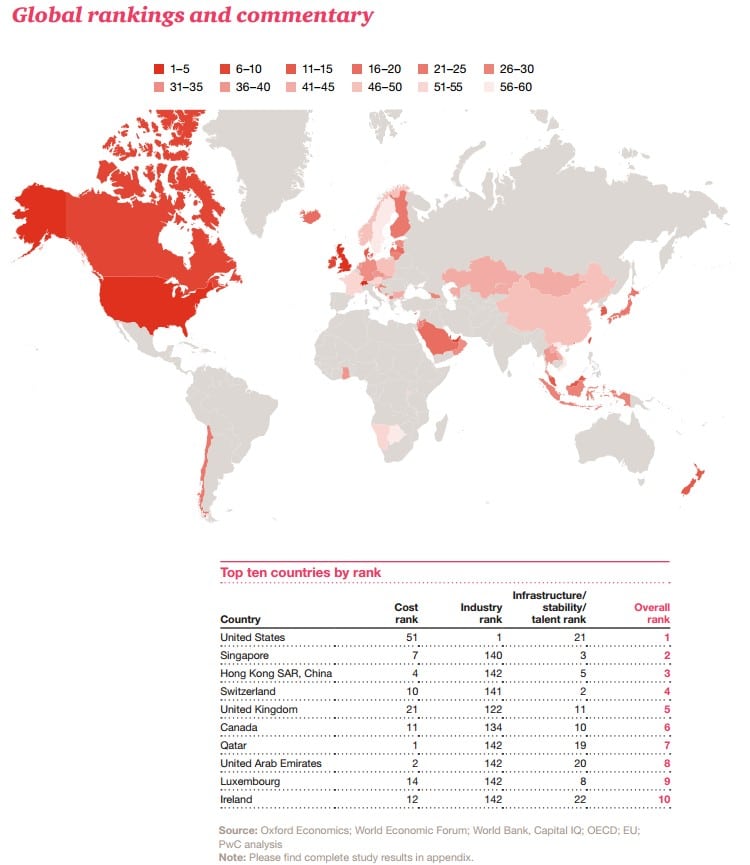
- The U.S. ranked 21st in the infrastructure/stability/talent category. Within this area, the U.S. ranked well in most metrics including scientific research institutions and research services, but ranked 47th in STEM education (Science Technology, Engineering, and Math), dragging down the overall ranking which was the second lowest among the top ten countries.
- The US ranked 51st in cost, the lowest among the top ten countries. Considering the cost category, the US is competitive in terms of pay and productivity (ranked ten), but 101st in tax cost.
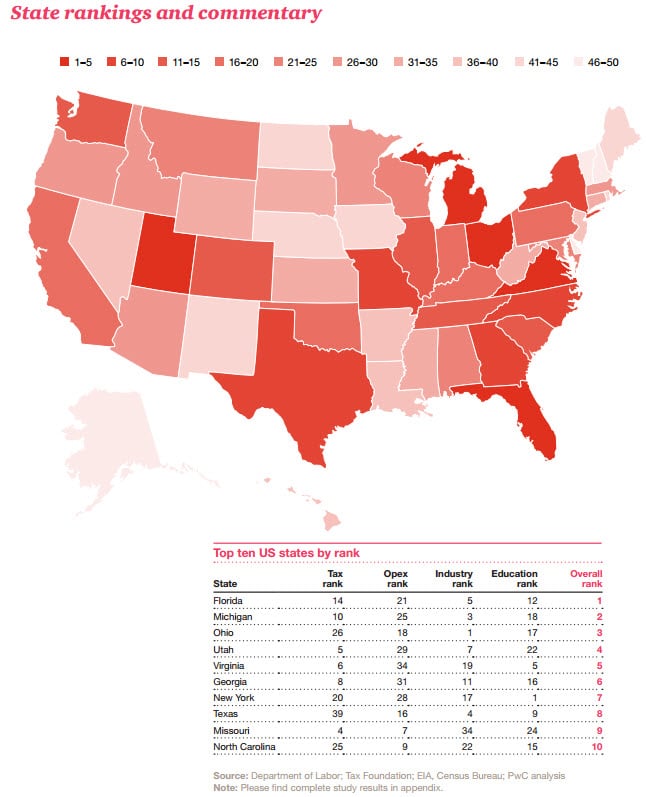
- The top ten U.S. states for aerospace manufacturing include Florida, Michigan, Ohio, Utah, Virginia, Georgia, New York, Texas, Missouri and North Carolina. Newcomers to the top ten included Utah, Virginia, New York, and North Carolina. New York had moderate rankings but was helped by an overall 1st rank in education. California fell out of the top ten list this year. While the state ranks 1st in industry employment and aerospace suppliers and 4th in education but its overall rank was dragged down because it was 43rd in industry growth and 46th in operating cost. Pennsylvania and Arizona also fell out of the top ten. The following graphic compares overall rankings by state.
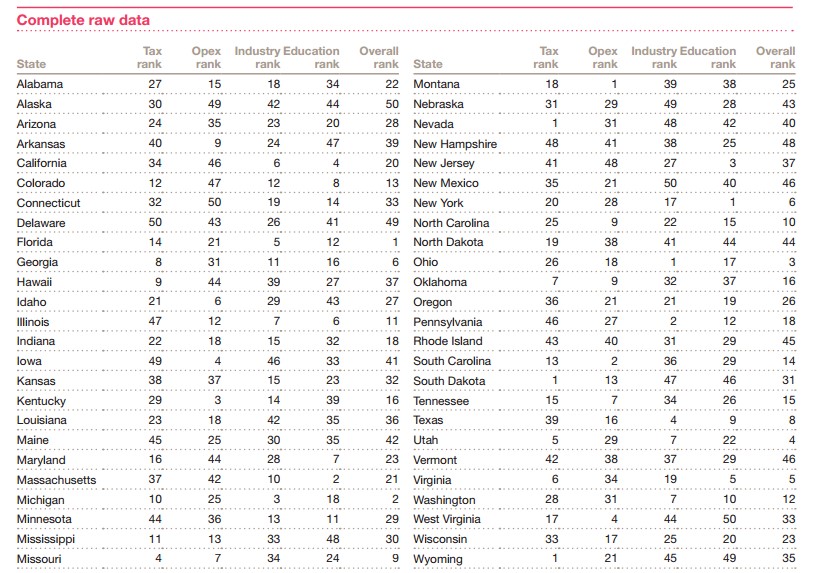
- PwC’s latest aerospace industry attractiveness of the U.S. in a state-by state comparison is now available. The PwC study produced an overall ‘attractiveness ranking index’ using a weighted average of the following major elements: taxes, operating costs (industry and overall wage rates, business climate, energy costs), industry size (existing suppliers and supply/growth of workforce including available aerospace technicians, engineers, mechanics), and educational attainment. The detailed raw data is shown below.